Here at Beta Breakers QA Labs, we rely on a number of different sources for industry information – this helps us make decisions on what hardware to purchase for our labs, what the general shape of various hardware/software markets look like, and helps us advise our partners and clients on what their support requirements should look like in a general sense. A couple of these sources come up a lot, so we’re taking a few minutes to discuss them; today we’re looking at the Steam Hardware Survey.
Important Note: each source has built-in biases and limitations that need to be taken into account when looking at data. In Steam’s case, it’s a wide-reaching gaming platform, so the hardware reflected in it is at least minimally capable of running games and is consequently likely to be somewhat higher-end than flat average. Participation in the Steam Hardware Survey is also voluntary and Steam does not report the total number of participants anymore; the total number of respondents and their respective geographic locations aren’t directly knowable. However, Steam does report their concurrent users (~33 million peak), so it’s reasonable to infer that the sample group for any individual instance of the Survey is in the millions.
The Steam Hardware Survey’s biggest value, from our perspective, is that it provides a window on hardware configurations and components in common use – video cards, CPUs, hard drive sizes, etc. This information is not only interesting in its own right, but vital to constructing real-world test matrices for projects that are hardware sensitive, such as games or 3D design software. At the top level, the Steam Survey displays very broad statistics:
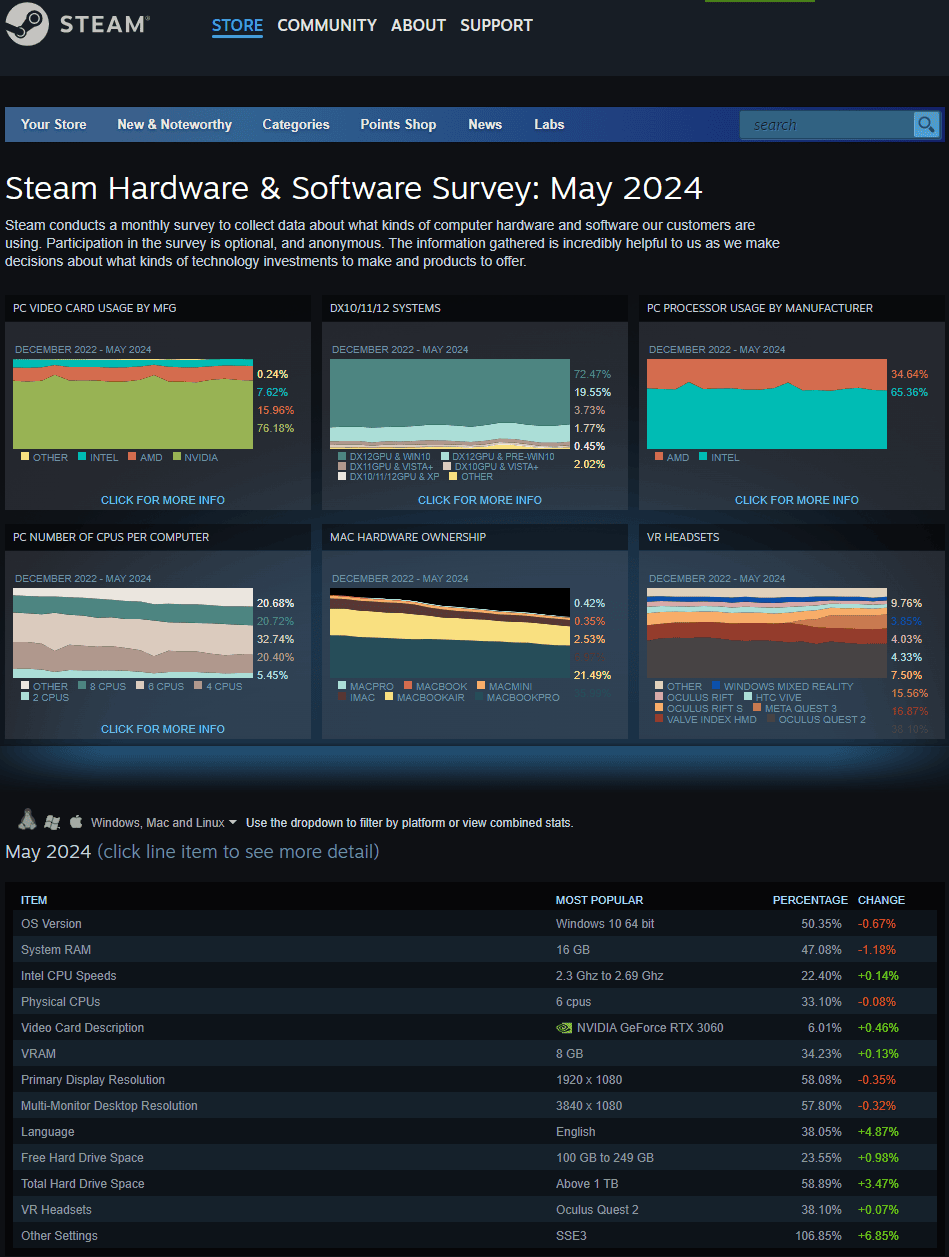
These are useful for high-level planning and for understanding the relative distribution of certain components, but where the Survey really shines is when you expand these categories out and examine the data within. Let’s take a look at Video Cards (side note: I prefer the expanded accordion view for most things, but clicking on the summary chart brings up a different view of the same data that includes changes over time, which is cool):
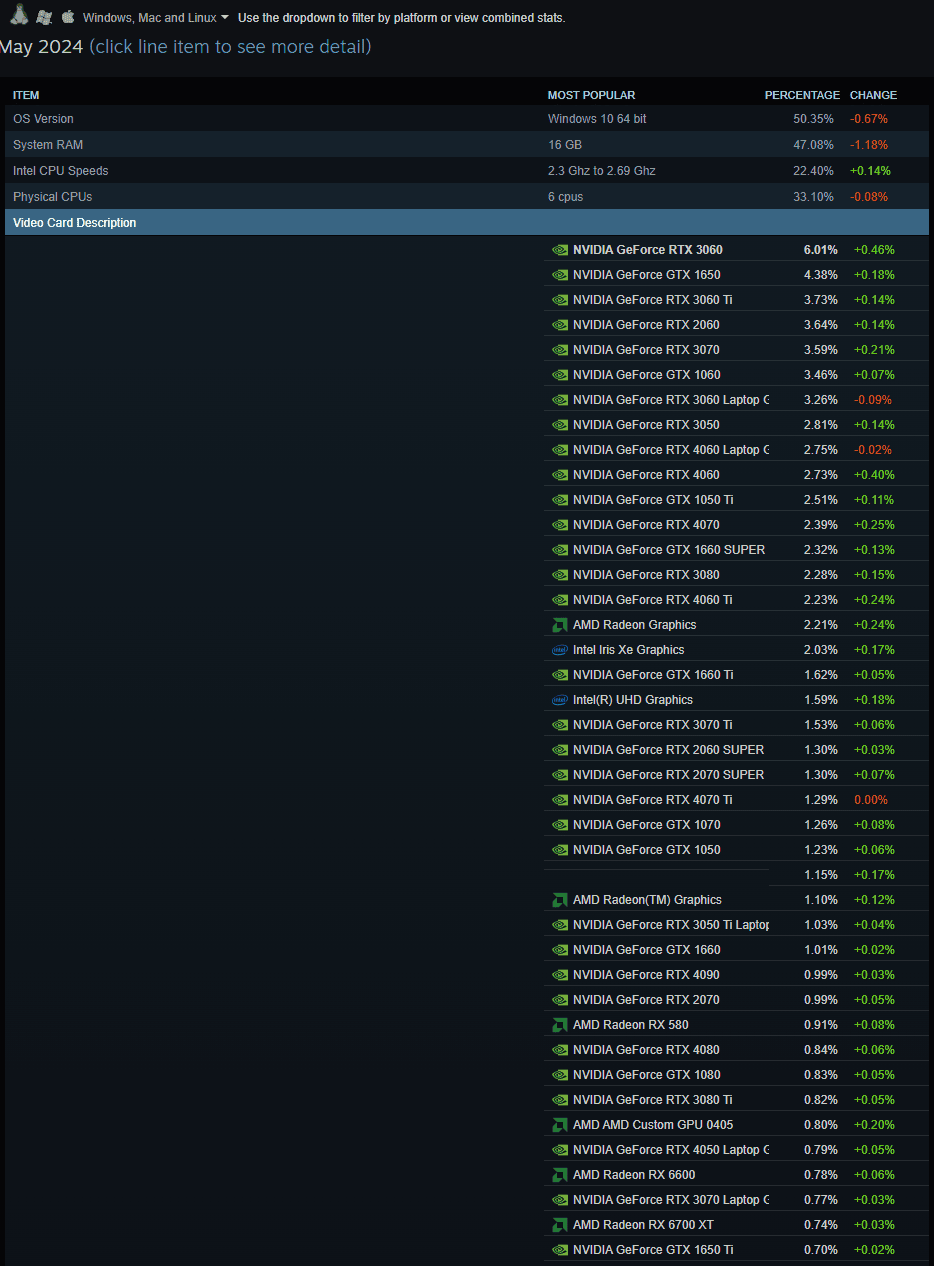
A few thing stand out here at a glance:
- nVidia GPUs are overwhelmingly popular; we can also see this clearly from the summary chart though, even without expanding.
- Mid-range GPUs vastly outweigh the high-end; despite the reputation of PC gamers for using performance components, affordability is still a big concern. Even most of the high-end cards near the top are not the highest-end models.
- Common AMD GPUs include a number of integrated solutions; these stand out because AMD isn’t traditionally known for integrated video, and because integrated GPUs tend to be lower-performance than discrete cards, in general.
- Speaking of integrated GPUs, Intel places surprisingly high on the list; while no one recommends Intel GPUs for gaming, they obviously get used for it nonetheless (that’s not a knock on Intel graphics – they’re efficient and commonplace and great for most uses; they just aren’t ideal for 3D gaming).
- GPU usage percentages by general model are pretty tiny; even a 1-2% share is significant, and enough to place a GPU near the top of the charts. A wise move is to composite GPUs together by generation (all nVidia RTX 2000-series, for example) to get a broader view of how they line up, but this is something you have to do manually, as the Survey doesn’t give you that fine of control over how data is displayed.
Other categories bring similar revelations to light as they are expanded; there’s a trove of granular details that can be extracted from the Steam Hardware Survey with just a little bit of digging. There’s also that nifty bug right in the center of the expanded Video Card list where no GPU name is provided. Oops!
While the Steam Hardware Survey isn’t the be all and end all of hardware statistics, it provides a convenient and well-organized view, as well as a relatively deep sampling of hardware, even with the gaming bias; Beta Breakers QA Labs refer back to it frequently when we are asked to draw up compatibility testing matrices, or to trim back such a matrix to focus solely on components that are most likely to be in use. We also use it when deciding what components to stock in our compatibility testing labs, especially when we need to backfill and can put more emphasis on popularity/market share.